GEMspa
A plugin for analysis of single particle tracking experiments
This plugin provides for analysis tools for data from single particle tracking experiments. It provides an interface for particle localization and tracking using trackpy. It also allows for import of tracking data from Mosaic and Trackmate. These files must be tab/comma delimited text files. It provides an option to exclude particles/tracks masked with a labels layer.
There are 5 tabs available in the plugin, following the workflow of data analysis:
- New/Open: open nd2/tiff time-lapse movie files and/or import a tracks layer (from Mosaic, Trackmate or napari-gemspa saved tracks layer)
- Locate: locate particles with trackpy
- Link: link particles with trackpy
- Filter Links: filter links with trackpy
- Analyze: Perform analysis on tracks from a tracks layer (can be from imported file from step 1 or layer created in step 3)
Detailed description of features:
- New/Open
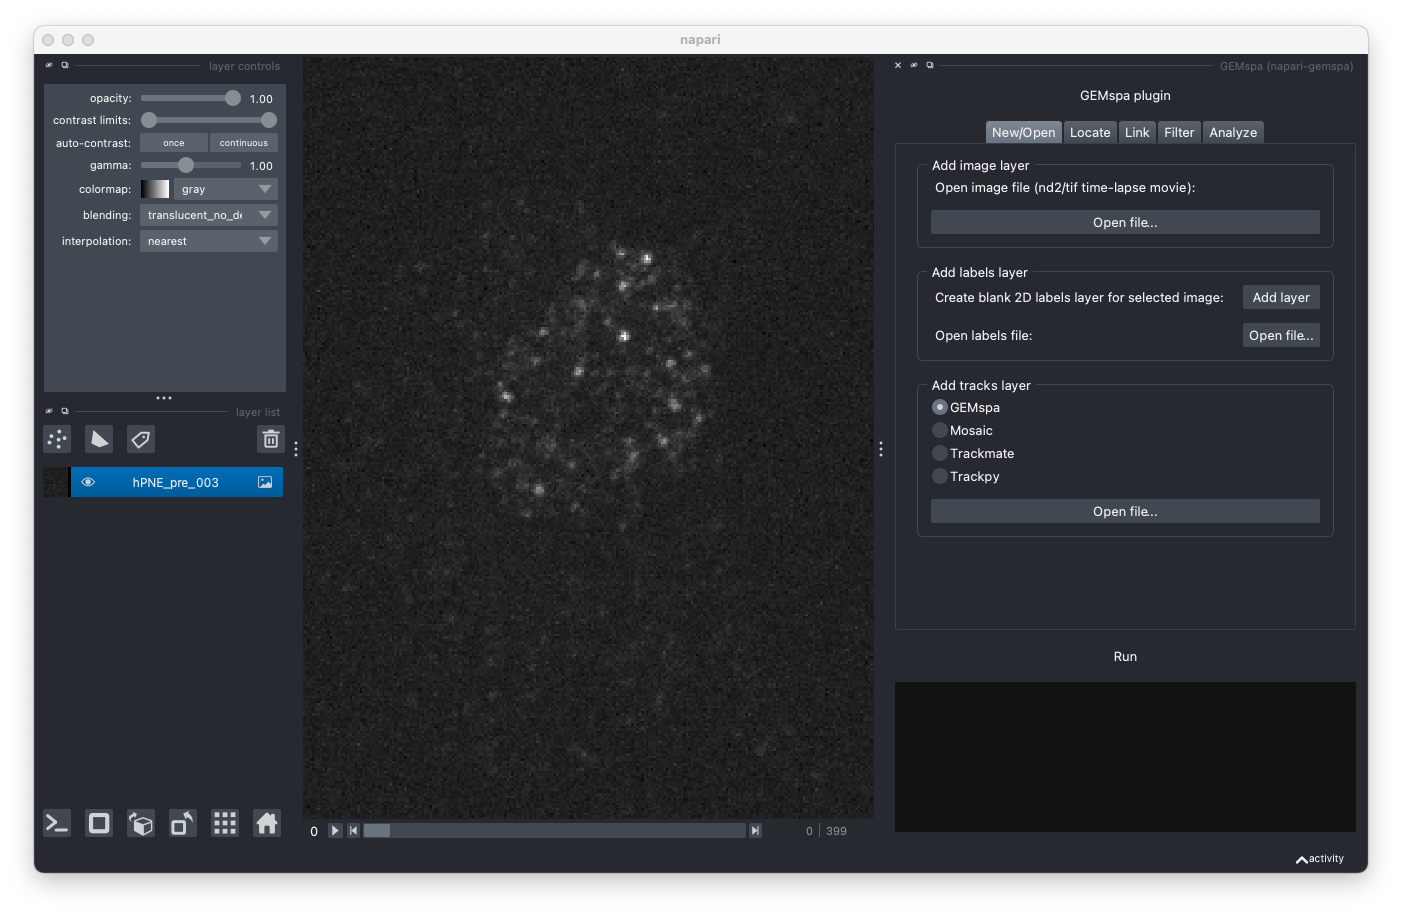
Add layer button will create a blank 2D (no time dimension) layer that is the same height/width as the currently selected image layer. Alternatively, a labeled mask can be opened from a file. The labels layer can be used to provide a mask for excluding areas of the image from analysis.
Track files from other software or previously saved by GEMspa can also be imported in this pane. Only tab/comma (.csv/.txt/.tsv) delimited text files are allowed.
GEMspa expects these columns in the header: ['track_id', 'frame', 'z', 'y', 'x']
Mosaic expects these columns in the header: ['Trajectory', 'Frame', 'z', 'y', 'x']
Trackmate expects these columns in the header: ['TRACK_ID', 'FRAME', 'POSITION_Z', 'POSITION_Y', 'POSITION_X'],
- 3 rows will be skipped for Trackmate files (assumes data begins at the 4th row after the header)
Trackpy expects these columns in the header: ['particle', 'frame', 'z', 'y', 'x']
(All columns are case and order insensitive)
- Locate
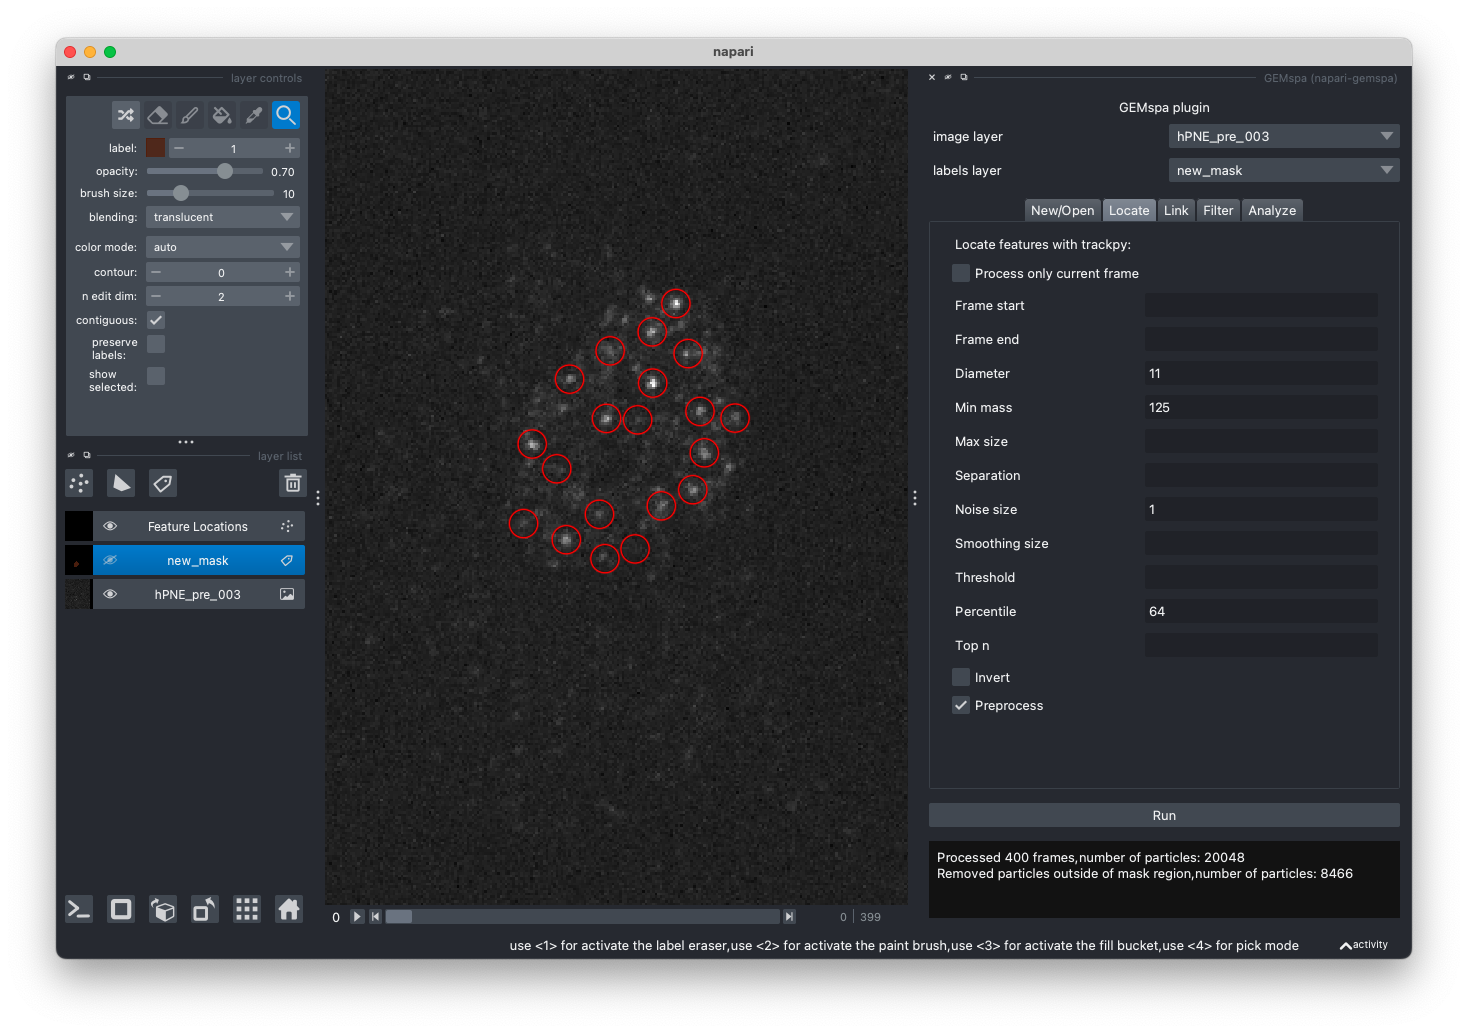
In this tab, adjust the parameters and perform particle localization with trackpy.locate. To first test out parameters on a single frame, check the "Process only current frame" checkbox. Please refer to the trackpy documentation for more details on parameters.
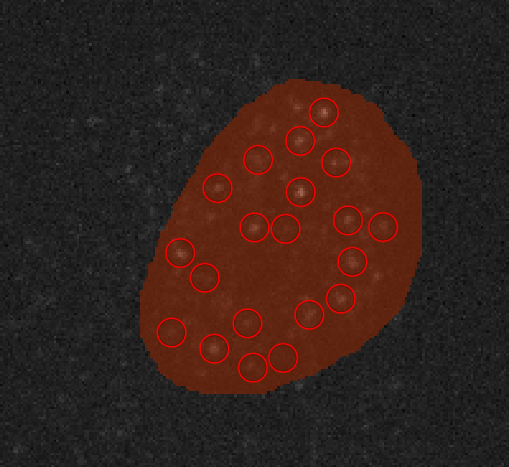
After localization is performed, a new points layer will be created and particles will be shown circled in red. In the example, we have used a labels layer to exclude particles outside an ROI (this is optional):
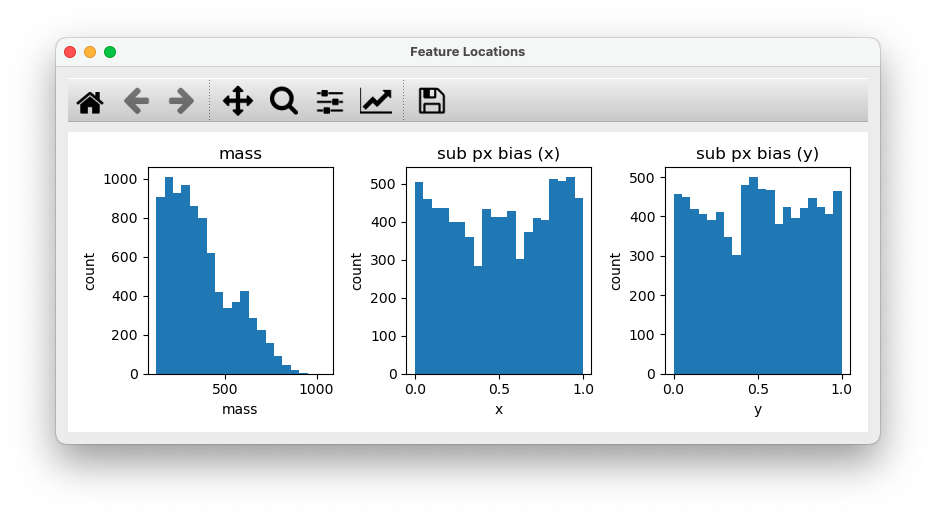
In addition, the mass histogram and subpixel bias histograms will be shown for help with adjusting the mass and diameter parameters:
- Link
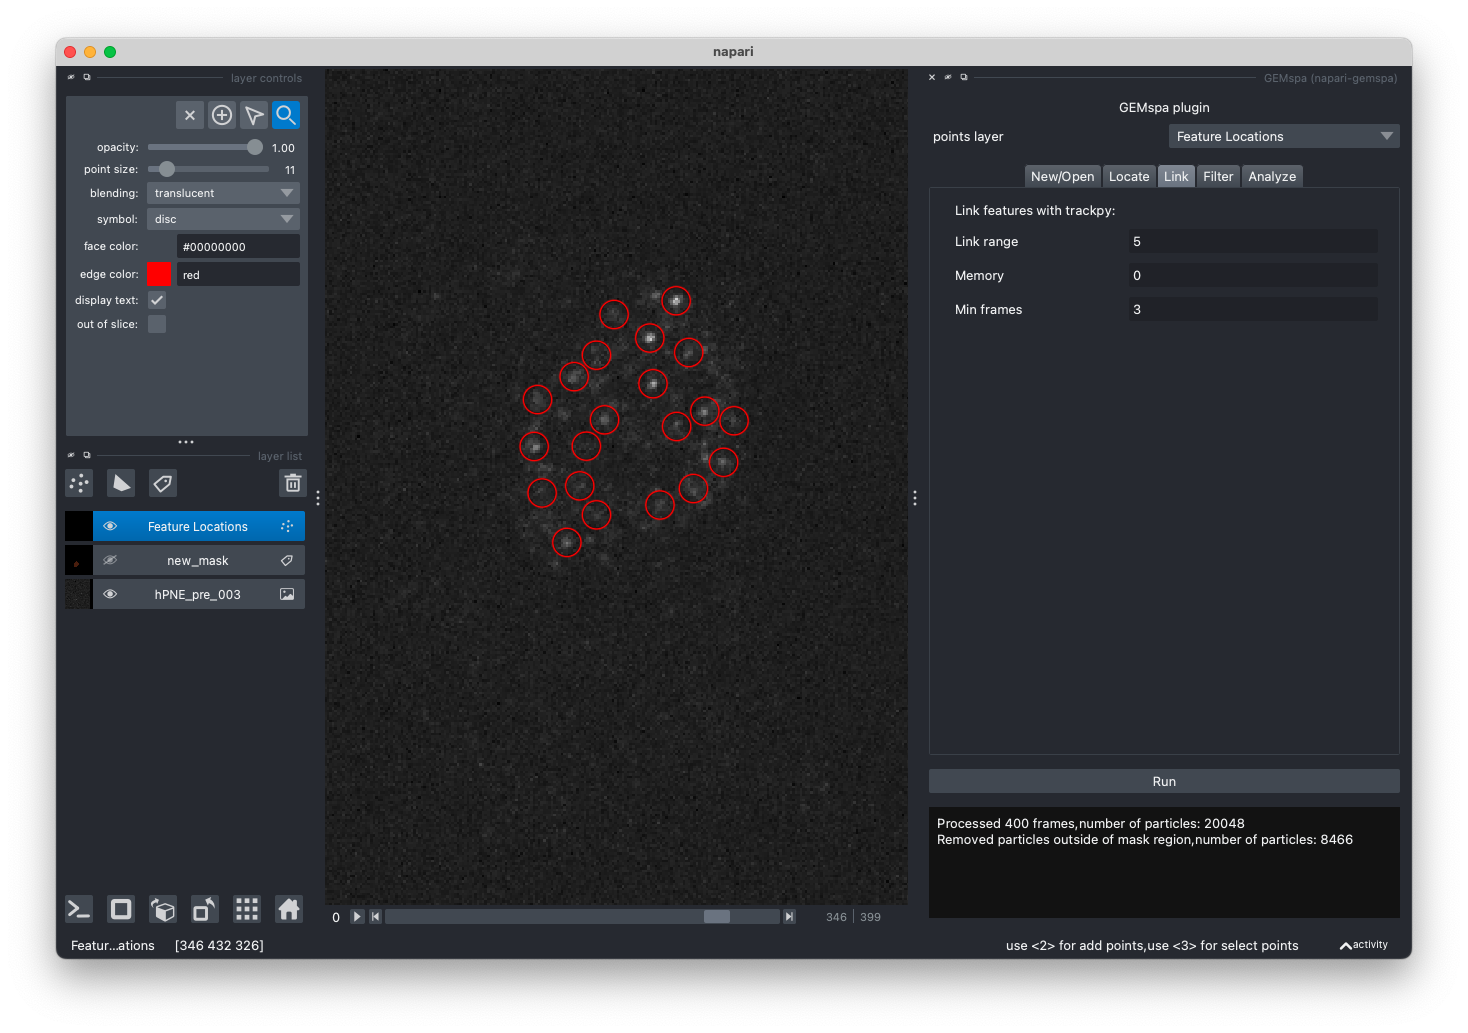
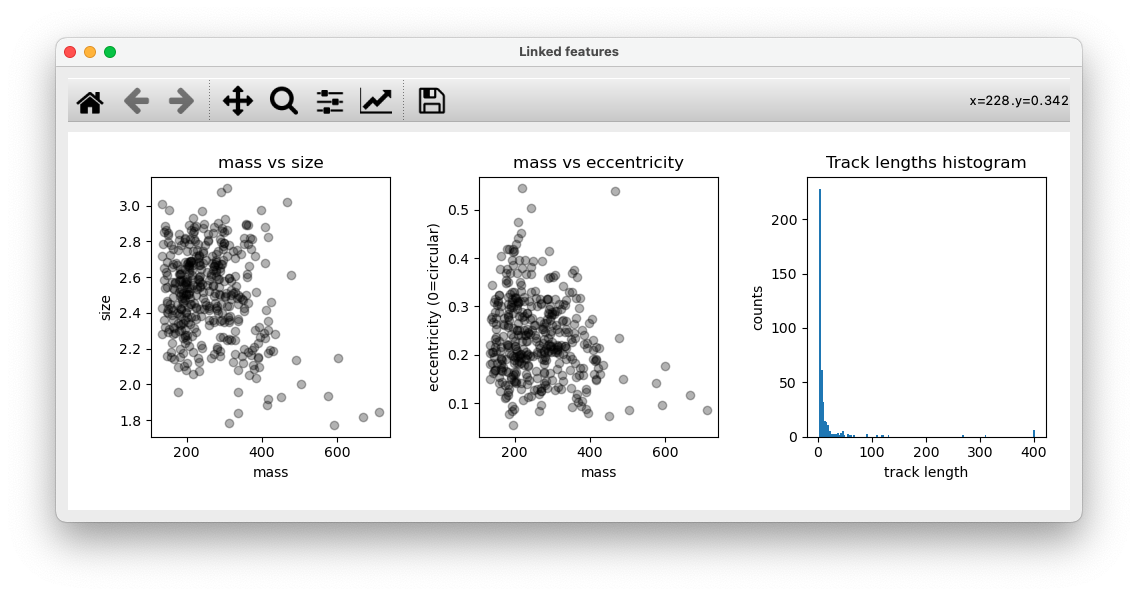
In this tab, adjust parameters and perform linking with trackpy.link. Once linking is performed a new tracks layer will be added. Please refer to the trackpy documentation for more details on parameters.
In addition, scatter plots of mass vs. size and mass vs. eccentricity, as well as the track lengths histogram are shown for help with filtering tracks. (next step)
- Filter
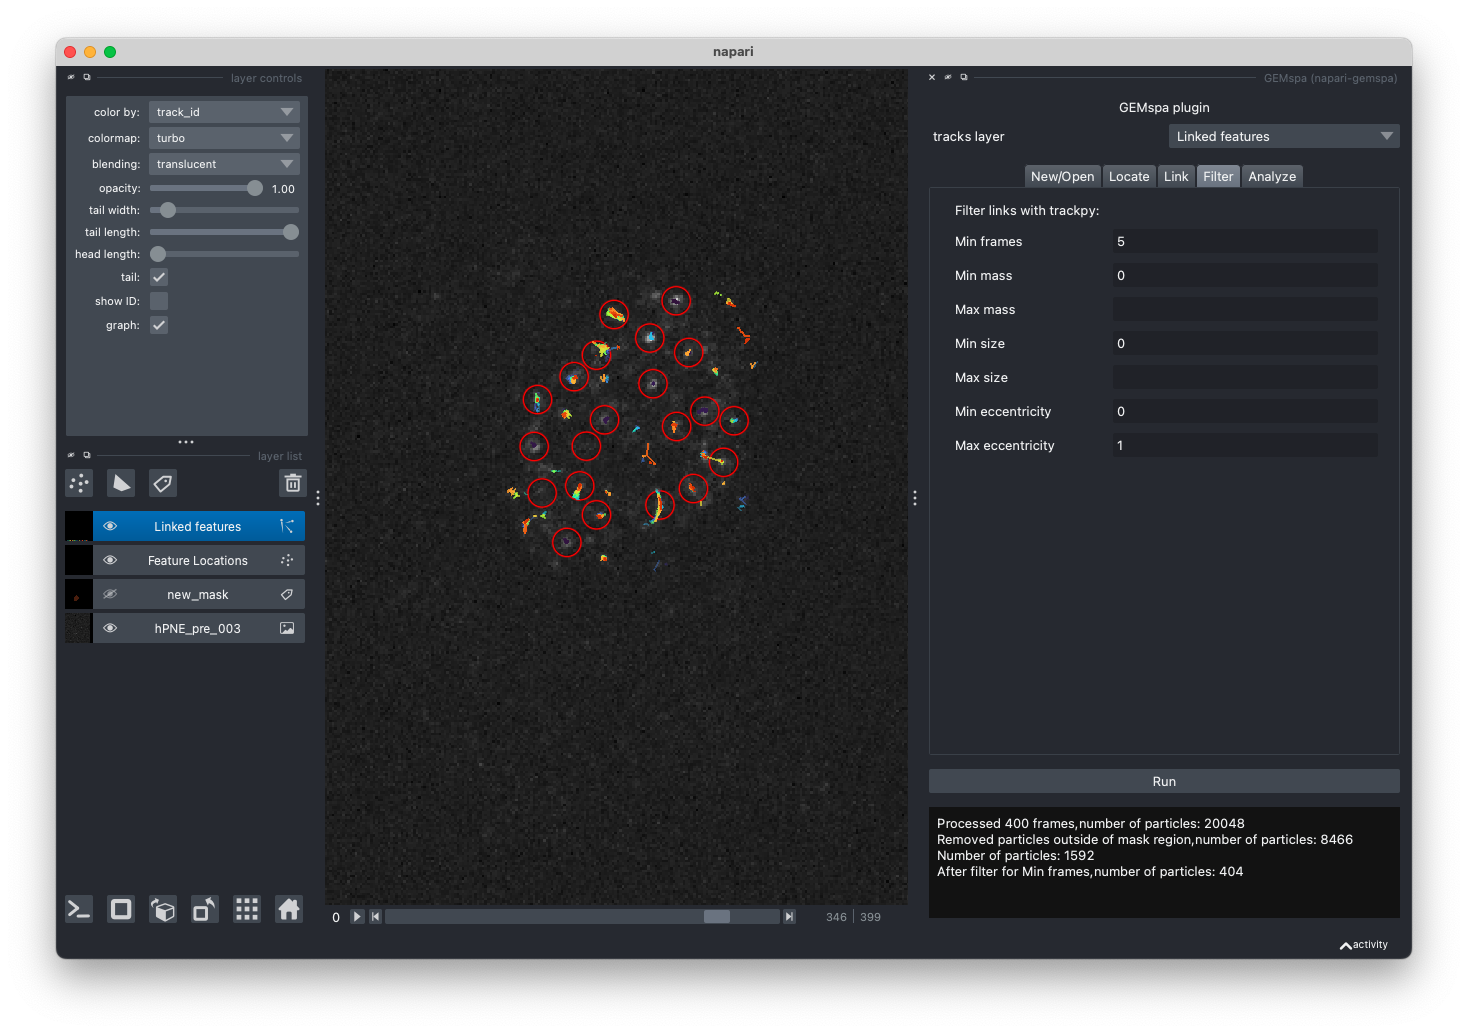
In this tab, adjust parameters and filter links from trackpy output. After filtering, a new layer will be added to napari with the filtered tracks and the same plots as shown in step 4 will be displayed.
- Analyze
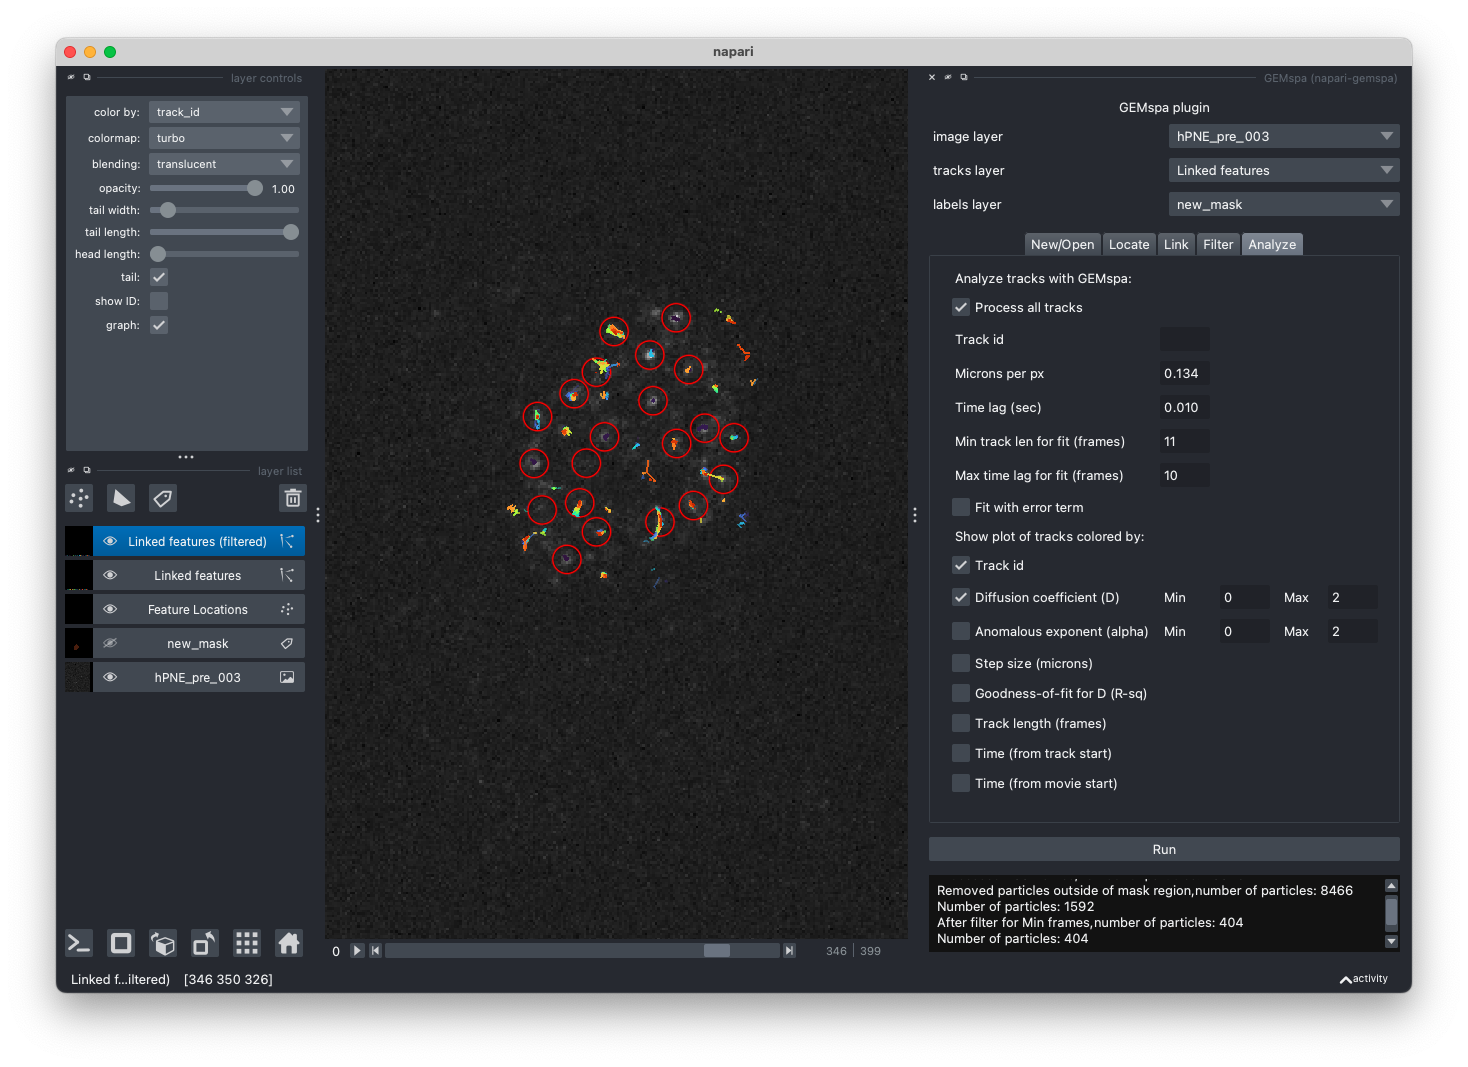
In this tab, adjust parameters and perform analysis. You may process all tracks or enter a track id and deselect the "Process all tracks" check box. Enter the appropriate parameters for converting pixels to microns and the time lag (in seconds) between frames of the movie.
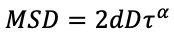
GEMspa will calculate the effective diffusion coefficient (D) for each track based on the mean squared displacement values (MSD) for each time-lag using this equation:

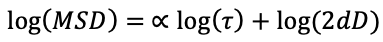
This is the diffusion coefficient with the assumption of Brownian motion. GEMspa will also calculate the generalized diffusion coefficient and anomalous exponent using this equation:
The fitting is performed on a log-log scale where the slope corresponds to the anomalous exponent (alpha):
Definition of terms:
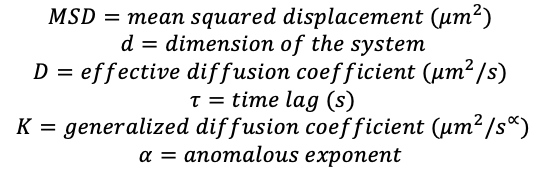
This review: Manzo et al is useful for learning more about these and other analysis methods.
Min track len for fit: all tracks less than this length will be excluded from calculations of effective diffusion coefficient and anomalous exponent.
Max time lag for fit: GEMspa will fit the MSD up to the max time-lag entered here. (in frames)
Fit with error term: check this box to allow a y-intercept when fitting for effective diffusion coefficient:
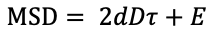
Check these papers by Martin, et al and Xavier Michalet for some information on fitting MSD with localization error.
Rainbow tracks
GEMspa can output a plot where the tracks are colored by any of the listed quantities. Check each box that you would like to see.
For the effective diffusion coefficient and anomalous exponent, set the Min/Max cutoffs for the track color map. Any tracks at or below the minimum will be colored with the minimum color (blue). Any tracks at or above the maximum will be colored with the maximum color (red).
Plots
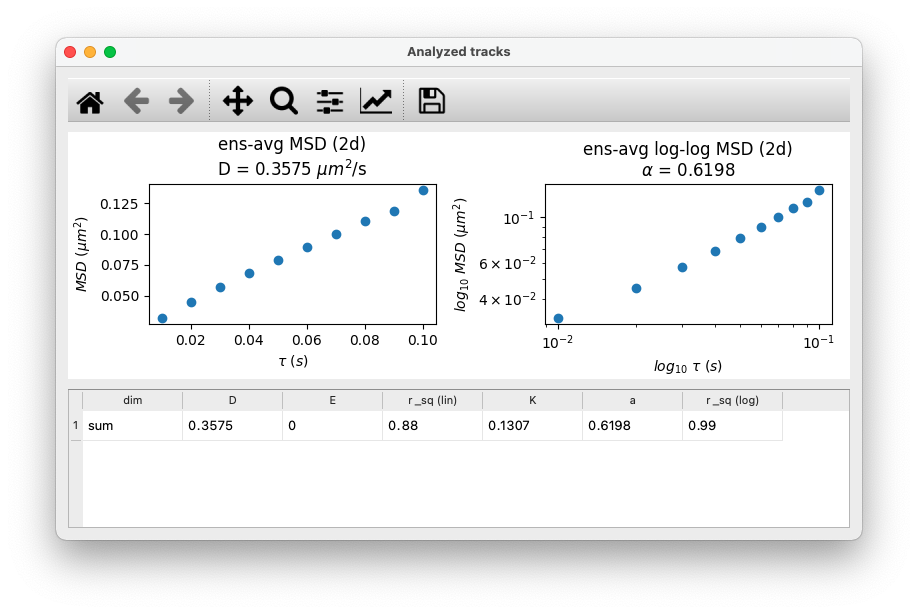
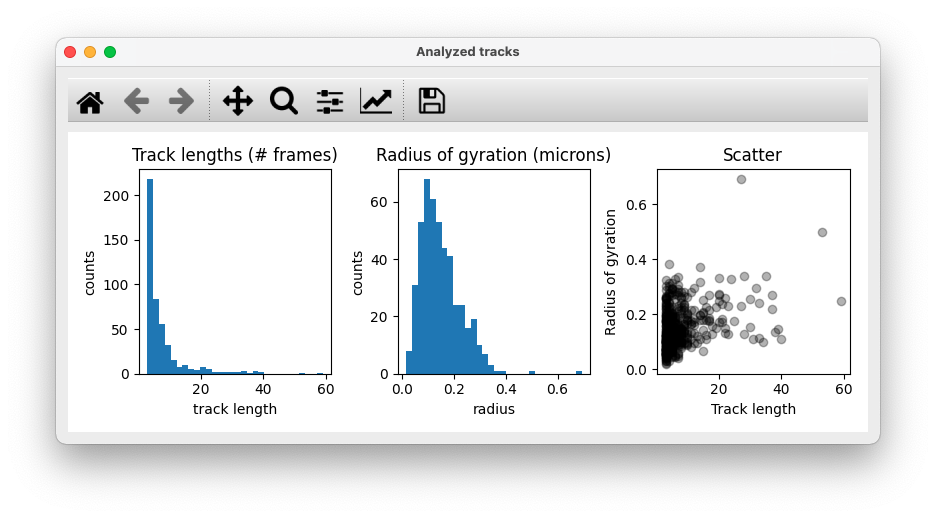
GEMspa will also output summary plots including:
- Ensemble average MSD shown on linear and log-scale with results from fitting the MSD vs time-lag data from the ensemble average MSD.
- Track length histogram, Radius of gyration (for full track lengths) histogram, Scatter plot of track length vs. radius of gyration
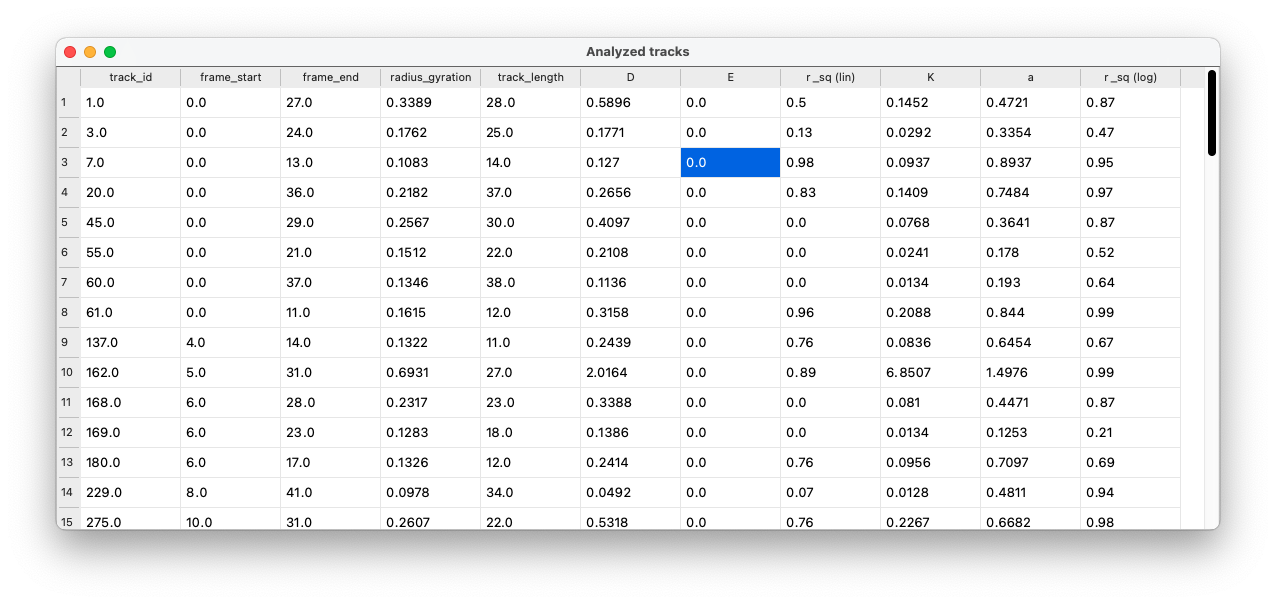
Tracks data table
GEMspa will output a table of data in a new pop-up window with data for each track. This table will only show one line for each track (not one line for every particle position) and it will output the following data:
- track_id
- frame_start
- frame_end
- radius_gyration: radius of gyration for the full track length (See Elliot et al)
- track_length
- D: effective diffusion coefficient
- E: y-intercept for the fit of MSD for D
- r_sq (lin): R-squared value for goodness-of-fit for the fit of MSD vs time-lag
- K: generalized diffusion coefficient
- a: anomalous exponent (alpha)
- r_sq (log): R-squared value for goodness-of-fit for the fit of log-log MSD vs. time-lag
New tracks layer
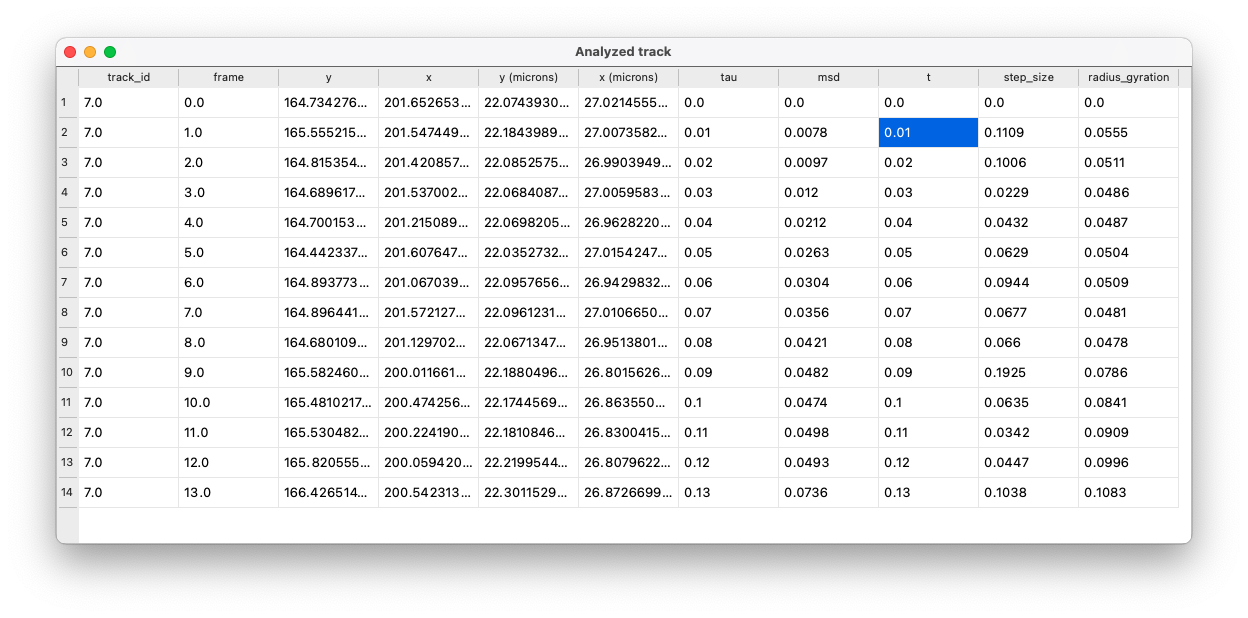
GEMspa will add a new tracks layer and save all data for each track in the properties of the tracks layer. Save the tracks layer to obtain a tab/comma-delimited text file with all analysis results. The data included for each track is:
- track_id
- frame
- y: y position in pixels
- x: x position in pixels
- frame_start
- frame_end
- y (microns): y position in microns
- x (microns): x position in microns
- tau: time-lag in seconds
- MSD: mean squared displacement
- t: time in seconds from start of track
- step_size
- radius_gyration: radius of gyration at each time point of track (See Elliot et al)
- track_length
- D: effective diffusion coefficient
- E: y-intercept for the fit of MSD for D
- r_sq (lin): R-squared value for goodness-of-fit for the fit of MSD vs time-lag
- K: generalized diffusion coefficient
- a: anomalous exponent (alpha)
- r_sq (log): R-squared value for goodness-of-fit for the fit of log-log MSD vs. time-lag
To extract this data, save the layer as a tab or comma delimited text file (txt/tsv/csv). GEMspa will save all track information.
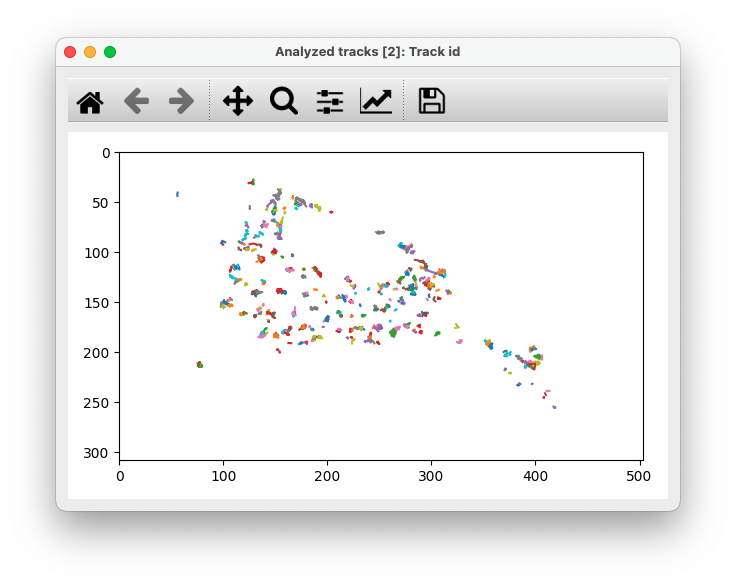
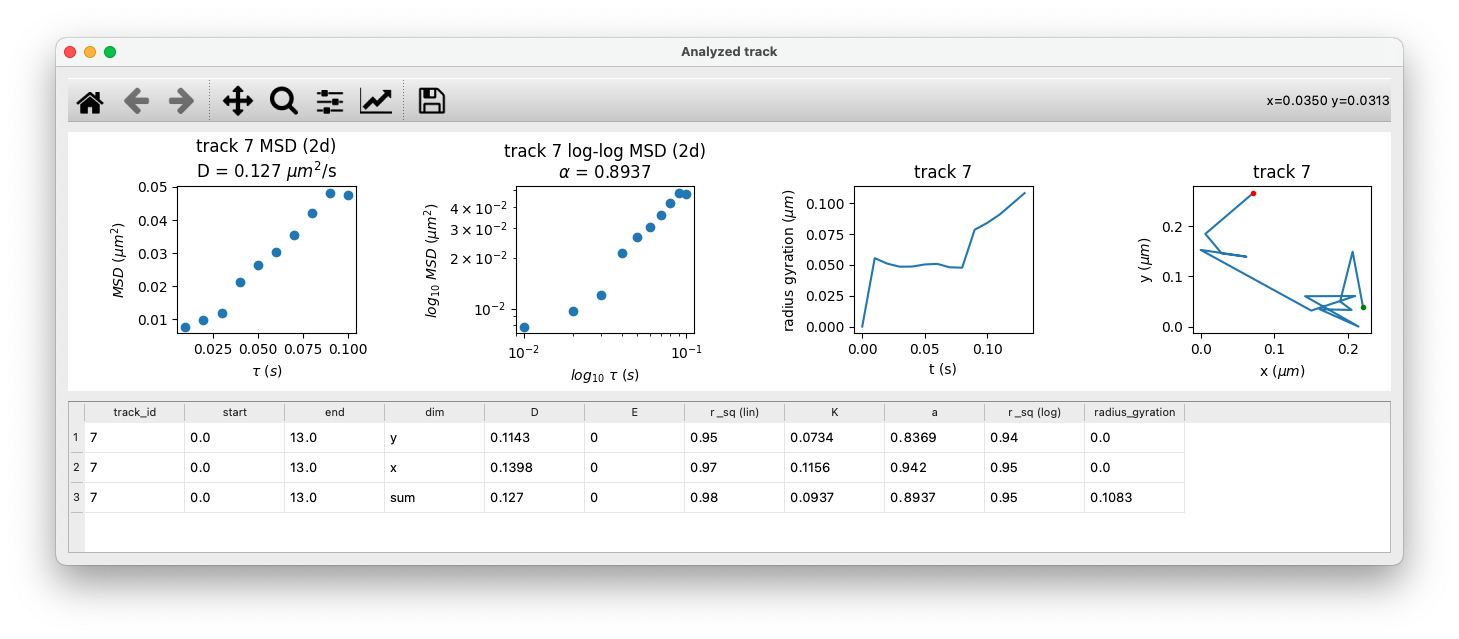
Analysis for a single track
GEMspa also provides the option to select a single track and output analysis results. Detailed information is shown for the selected track, including a plot of the radius of gyration at each time point and a plot of the track itself.
Here is an example:
Supported data:
- Information not submitted
Plugin type:
GitHub activity:
- Stars: 0
- Forks: 1
- Issues + PRs: 0